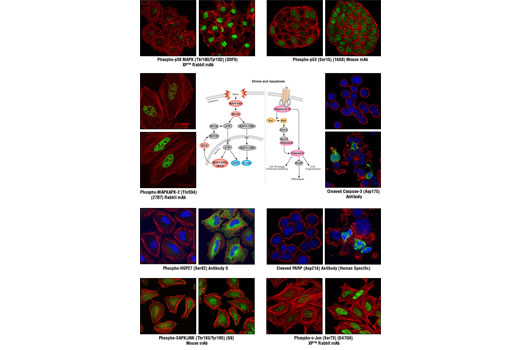
Signaling pathway for antibodies in the PathScan ® Multi-Target HCA Stress and Apoptosis Kit. Representative confocal immunofluorescent images display typical localization of the individual proteins in untreated (left or top) or treated (right or bottom) cells.

Schematic representation of a potential 96-well plate layout for the PathScan ® Multi-Target HCA Stress and Apoptosis Kit. On this generic map, four treatments are performed in triplicate down the columns of the plate, while each of the eight antibodies is applied across individual rows of the 96-well plate. This layout is designed to allow the investigator to monitor the signaling of cellular stress and apoptotic pathways on one 96-well plate. The diagram above is one example; users may wish to reorganize plate map according to their needs.

A549 cells were left untreated (blue) or treated with 25 μg/ml anisomycin (red) or 1μM staurosporine (green). Mean fluorescence intensity was measured for antibodies in the PathScan ® Multi-Target HCA Stress and Apoptosis Kit. Data were generated on the Acumen ® HCS platform.

HeLa cells were exposed to varying concentrations of staurosporine for 3 hr. With increasing concentrations of staurosporine, there was a significant decrease (~2.5-fold) in phospho-MAPKAPK-2 as compared to the untreated control. When using phospho-MAPKAPK-2 as a measurement, the IC 50 of this compound was 92.5 nM.


