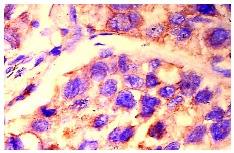
CDw75 (ZB55): sc-20063. Immunoperoxidase staining of formalin fixed, paraffin-embedded human liver tumor showing membrane and cytoplasmic localization.
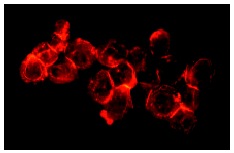
CDw75 (ZB55): sc-20063. Immunofluorescence staining of methanol-fixed NAMALWA cells showing membrane localization.
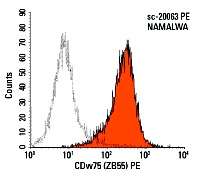
CDw75 (ZB55) PE: sc-20063 PE. FCM analysis of NAMALWA cells. Black line histogram represents the isotype control, normal mouse IgM: sc-2870.
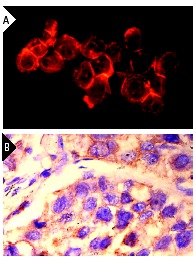
CDw75 (ZB55): sc-20063. Immunofluorescence staining of methanol-fixed NAMALWA cells showing membrane localization (A). Immunoperoxidase staining of formalin fixed, paraffin-embedded human liver tumor showing membrane and cytoplasmic localization (B).
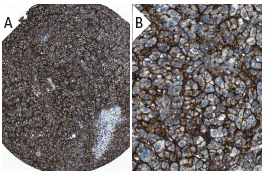
CDw75 (ZB55): sc-20063. Immunoperoxidase staining of formalin fixed, paraffin-embedded human liver cancer showing membrane staining of tumor cells (low and high magnification). Kindly provided by The Swedish Human Protein Atlas (HPA) program.
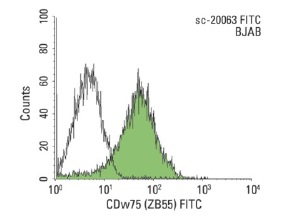
CDw75 (ZB55): sc-20063. Indirect FCM analysis of BJAB cells stained with CDw75 (ZB55), followed by FITC-conjugated goat anti-mouse IgM: sc-2082. Black line histogram represents the isotype control, normal mouse IgM: sc-3881.
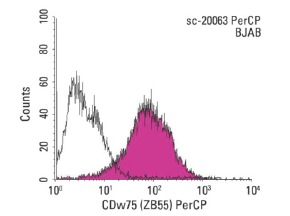
CDw75 (ZB55): sc-20063. Indirect FCM analysis of BJAB cells stained with CDw75 (ZB55), followed by PerCP-conjugated goat anti-mouse IgM: sc-45094. Black line histogram represents the isotype control, normal mouse IgM: sc-3881.
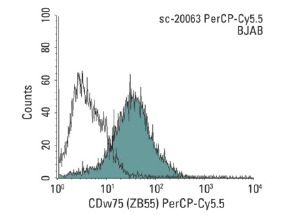
CDw75 (ZB55): sc-20063. Indirect FCM analysis of BJAB cells stained with CDw75 (ZB55), followed by PerCP-Cy5.5-conjugated goat anti-mouse IgM: sc-45105. Black line histogram represents the isotype control, normal mouse IgM: sc-3881.
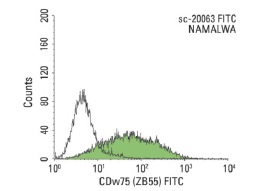
CDw75 (ZB55) FITC: sc-20063 FITC. FCM analysis of NAMALWA cells. Black line histogram represents the isotype control, normal mouse IgM: sc-2859.


