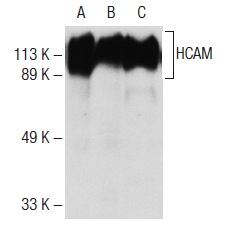
HCAM (IM7): sc-18849. Western blot analysis of HCAM expression in mouse peripheral blood (A), HUV-EC-C (B) and HISM (C) cell lysates.
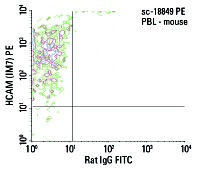
HCAM (IM7) PE: sc-18849 PE. FCM analysis of mouse peripheral blood leukocytes. Quadrant markers were set based on the isotype control, normal rat IgG
2b: sc-2873.
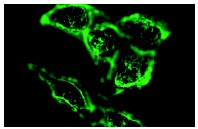
HCAM (IM7): sc-18849. Immunofluorescence staining of methanol-fixed HeLa cells showing membrane staining.
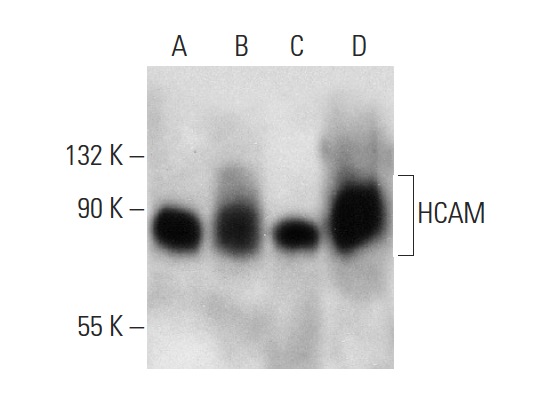
HCAM (IM7): sc-18849. Western blot analysis of HCAM expression in HUV-EC-C (A), human PBL (B), HeLa (C) and WI 38 (D) whole cell lysates.
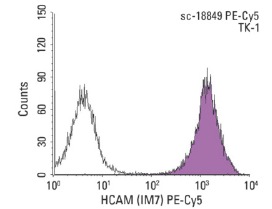
HCAM (IM7): sc-18849. Indirect FCM analysis of TK-1 cells stained with HCAM (IM7), followed by PE-Cy5-conjugated goat anti-rat IgG F(ab')
2: sc-3830. Black line histogram represents the isotype control, normal rat IgG
2b: sc-3884.
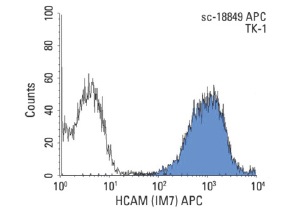
HCAM (IM7): sc-18849. Indirect FCM analysis of TK-1 cells stained with HCAM (IM7), followed by APC-conjugated goat anti-rat IgG F(ab')
2: sc-3832. Black line histogram represents the isotype control, normal rat IgG
2b: sc-3884.
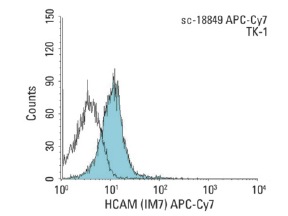
HCAM (IM7): sc-18849. Indirect FCM analysis of TK-1 cells stained with HCAM (IM7), followed by APC-Cy7-conjugated goat anti-rat IgG F(ab')
2: sc-3833. Black line histogram represents the isotype control, normal rat IgG
2b: sc-3884.
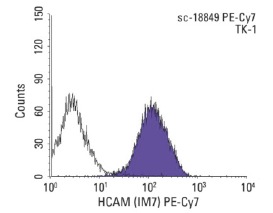
HCAM (IM7): sc-18849. Indirect FCM analysis of TK-1 cells stained with HCAM (IM7), followed by PE-Cy7-conjugated goat anti-rat IgG F(ab')
2: sc-3831. Black line histogram represents the isotype control, normal rat IgG
2b: sc-3884.
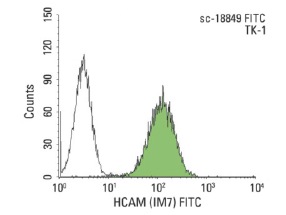
HCAM (IM7): sc-18849. Indirect FCM analysis of TK-1 cells stained with HCAM (IM7), followed by FITC-conjugated chicken anti-rat IgG: sc-2991. Black line histogram represents the isotype control, normal rat IgG
2b: sc-3884.
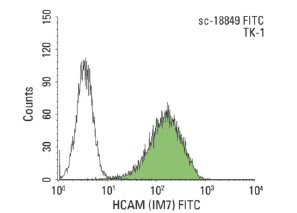
HCAM (IM7): sc-18849. Indirect FCM analysis of TK-1 cells stained with HCAM (IM7), followed by FITC-conjugated goat anti-rat IgG F(ab')
2: sc-3825. Black line histogram represents the isotype control, normal rat IgG
2b: sc-3884.
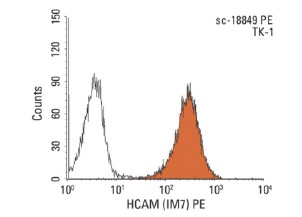
HCAM (IM7): sc-18849. Indirect FCM analysis of TK-1 cells stained with HCAM (IM7), followed by PE-conjugated chicken anti-rat IgG: sc-3763. Black line histogram represents the isotype control, normal rat IgG
2b: sc-3884.
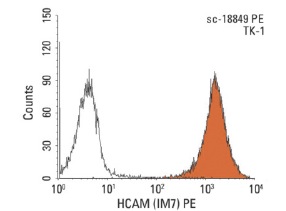
HCAM (IM7): sc-18849. Indirect FCM analysis of TK-1 cells stained with HCAM (IM7), followed by PE-conjugated goat anti-rat IgG F(ab')
2: sc-3829. Black line histogram represents the isotype control, normal rat IgG
2b: sc-3884.
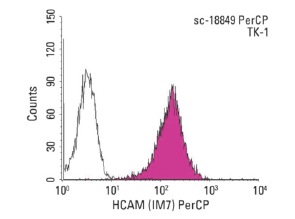
HCAM (IM7): sc-18849. Indirect FCM analysis of TK-1 cells stained with HCAM (IM7), followed by PerCP-conjugated goat anti-rat IgG: sc-45089. Black line histogram represents the isotype control, normal rat IgG
2b: sc-3884.
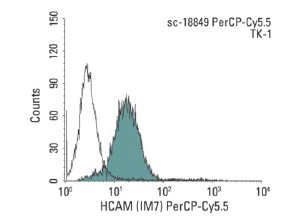
HCAM (IM7): sc-18849. Indirect FCM analysis of TK-1 cells stained with HCAM (IM7), followed by PerCP-Cy5.5-conjugated goat anti-rat IgG: sc-45100. Black line histogram represents the isotype control, normal rat IgG
2b: sc-3884.
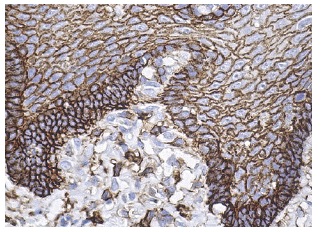
HCAM (IM7): sc-18849. Immunoperoxidase staining of formalin fixed, paraffin-embedded human esophagus tissue showing membrane staining of squamous epithelial cells.