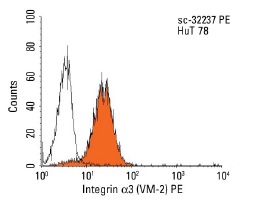
Integrin α3 (VM-2) PE: sc-32237 PE. FCM analysis of Hut78 cells. Black line histogram represents the isotype control, normal mouse IgG
1: 2866.
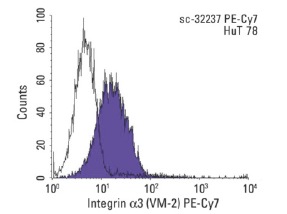
Integrin α3 (VM-2): sc-32237. Indirect FCM analysis of HuT 78 cells stained with Integrin α3 (VM-2), followed by PE-Cy7-conjugated goat anti-mouse IgG F(ab')
2: sc-3817. Black line histogram represents the isotype control, normal mouse IgG
1: 3877.
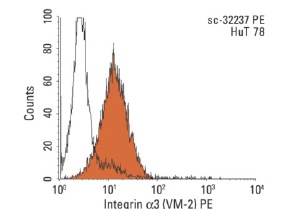
Integrin α3 (VM-2): sc-32237. Indirect FCM analysis of HuT 78 cells stained with Integrin α3 (VM-2), followed by PE-conjugated goat anti-mouse IgG F(ab')
2: sc-3798. Black line histogram represents the isotype control, normal mouse IgG
1: 3877.
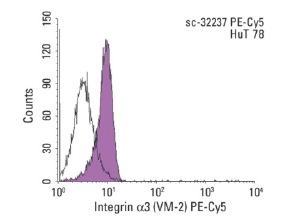
Integrin α3 (VM-2): sc-32237. Indirect FCM analysis of HuT 78 cells stained with Integrin α3 (VM-2), followed by PE-Cy5-conjugated goat anti-mouse IgG F(ab')
2: sc-3799. Black line histogram represents the isotype control, normal mouse IgG
1: 3877.
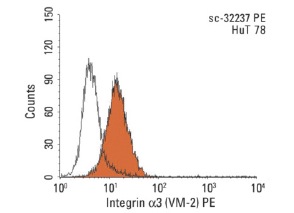
Integrin α3 (VM-2): sc-32237. Indirect FCM analysis of HuT 78 cells stained with Integrin α3 (VM-2), followed by PE-conjugated bovine anti-mouse IgG: sc-3749. Black line histogram represents the isotype control, normal mouse IgG
1: 3877.
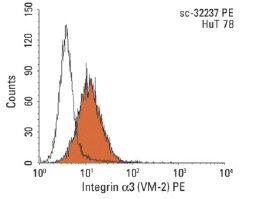
Integrin α3 (VM-2): sc-32237. Indirect FCM analysis of HuT 78 cells stained with Integrin α3 (VM-2), followed by PE-conjugated rabbit anti-mouse IgG: sc-358926. Black line histogram represents the isotype control, normal mouse IgG
1: 3877.


