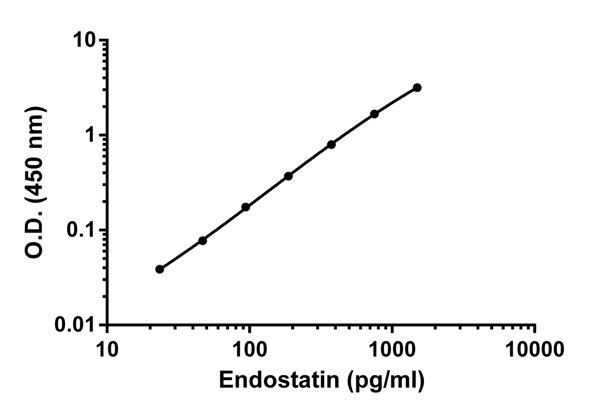
Example of Endostatin standard curve. Raw data values are shown in the table. Background-subtracted data values (mean +/- SD) are graphed.

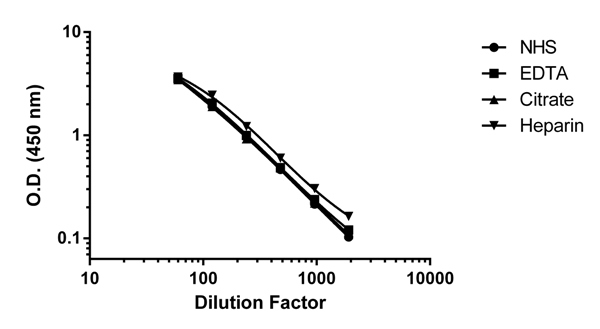
Titration of normal Human serum and plasma samples to within working range of the assay. Background subtracted data from duplicate measurements are plotted.

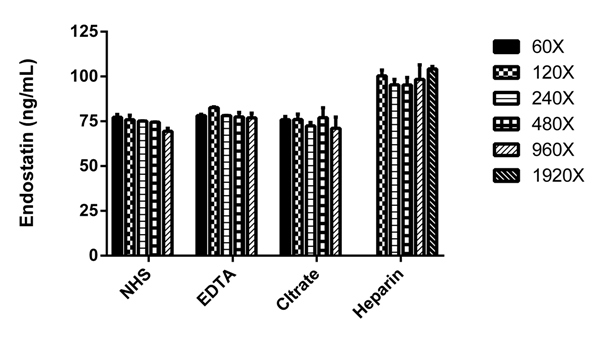
Titration of normal Human serum and plasma samples to within working range of the assay. Bar graph denotes quantification of Endostatin interpolated from standard curve and multiplied by dilution factor.

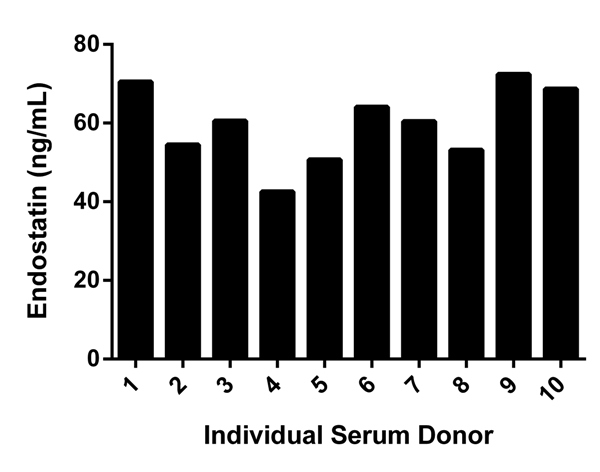
Titration of individual donor serum samples to within working range of the assay. Quantification of Endostatin interpolated from standard curve and multiplied by dilution factor.


