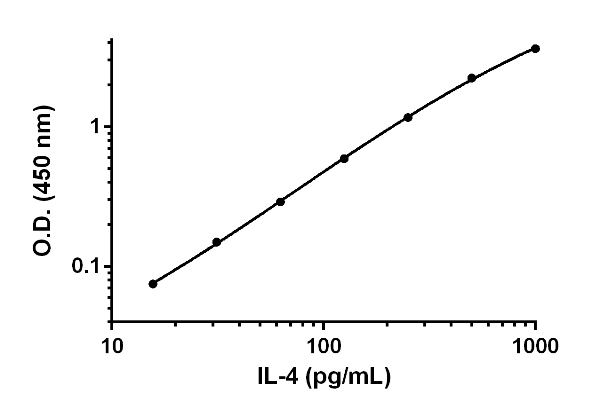
Background-subtracted data values (mean +/- SD) are graphed.
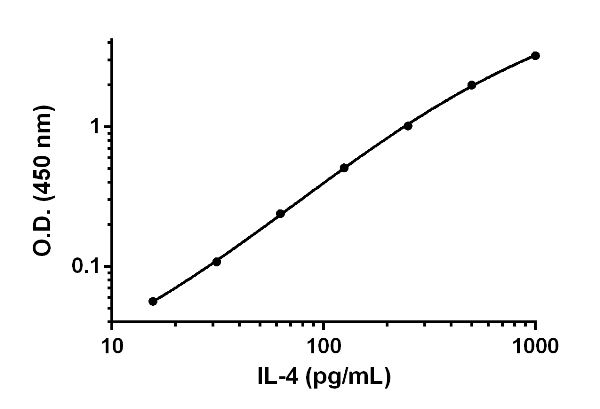
Background-subtracted data values (mean +/- SD) are graphed.
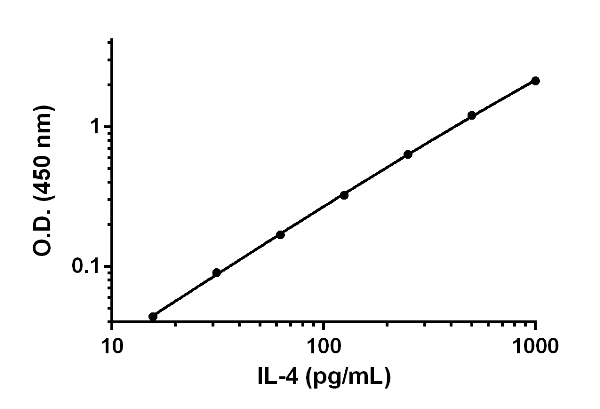
Background-subtracted data values (mean +/- SD) are graphed.
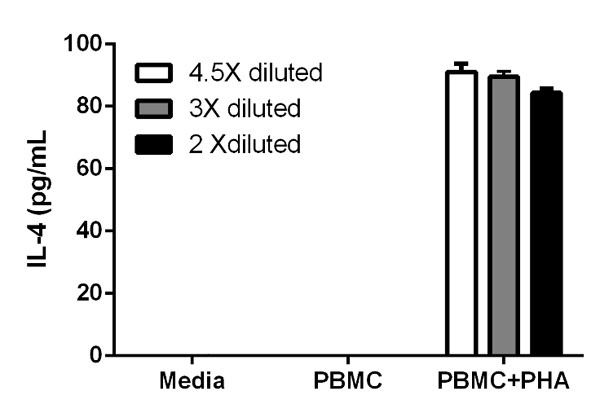
The concentrations of IL-4 were interpolated from data values shown in Figure 4 using IL-4 standard curve and corrected for sample dilution. The mean IL-4 concentration was determined to be 88 pg/mL of stimulated PBMC supernatants. IL-4 concentrations in unstimulated PBMC supernatants measured less than the MDD, 2 pg/mL.
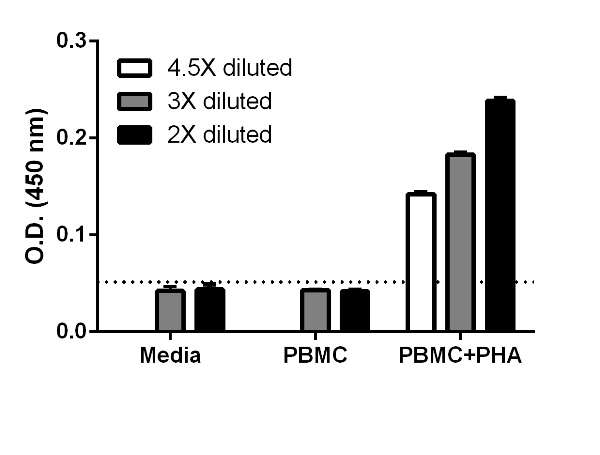
PBMC were grown in the absence or presence of phytohemagglutinin (PHA) for 2 days. IL-4 concentrations were measured in 4.5X, 3X and 2X diluted cell culture supernatants of the stimulated PBMC and in 3X and 2X diluted cell culture supernatants of unstimulated PBMC and media. Raw data values (mean +/-SD, n=5) are graphed. The dotted line represents zero sample background.


