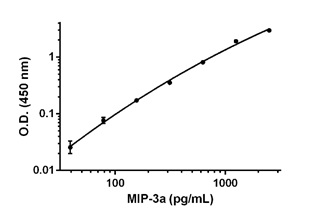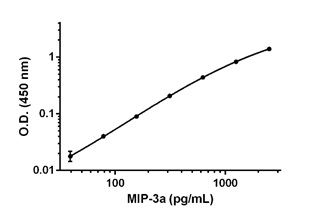
Background-subtracted data values (mean +/- SD) are graphed.

Background-subtracted data values (mean +/- SD) are graphed.

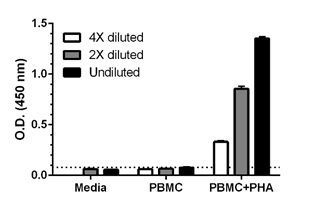
PBMC were grown in the absence or presence of phytohemagglutinin (PHA) for 2 days. MIP3a concentrations were measured in 4X and 2X diluted and undiluted (neat) cell culture supernatants of the stimulated PBMC, unstimulated PBMC and media. Raw data values (mean +/ SD, n=5) are graphed. The dotted line represents zero sample background.

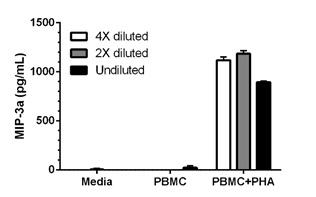
The concentrations of MIP3a were interpolated from data values shown in Figure 3 using MIP3a standard curve and corrected for sample dilution. Using 4X and 2X diluted samples, the mean MIP3a concentration in stimulated PBMC supernatants was determined to be 1,151 pg/mL. The undiluted sample of stimulated PBMC supernatant was not considered into the calculation because of poor recovery of MIP3a in 100% media (data not shown). MIP3a concentrations in unstimulated PBMC supernatants measured less than the MDD, 39 pg/mL.


