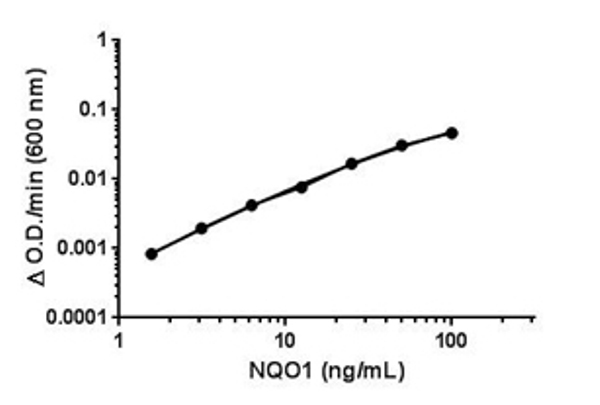
Background-subtracted data values (mean +/- SD) are graphed.
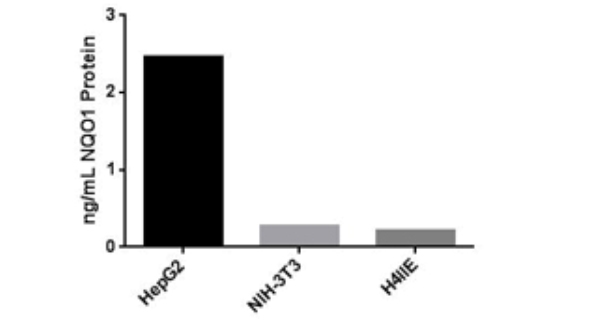
Human, mouse, and rat cell lysates (shown respectively left to right on graph) used at a concentration of 125 µg/mL were analyzed using this kit. Neither mouse NIH-3T3 nor rat H4IIE cells showed significant response. Background-subtracted data values (mean +/- SD) are graphed. The data shown was interpolated into the standard curve to show the concentration of NQO1 protein in each sample.
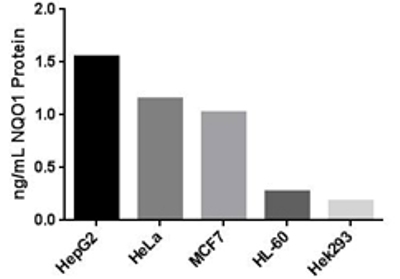
Human cell lysates used at a concentration of 62.5 µg/mL were analyzed using this kit. In agreement with Western blotting data, neither HL-60 nor Hek293 cells showed significant response. The data shown was interpolated into the standard curve to show the concentration of NQO1 protein in each sample.