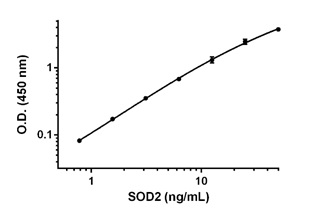
Background-subtracted data values (mean +/- SD) are graphed.
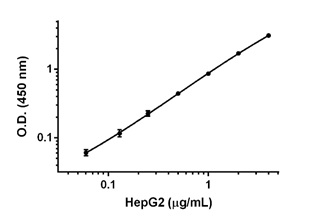
Background-subtracted data values from triplicate measurements (mean +/- SD) are graphed.
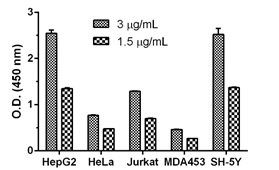
Background-subtracted data values from triplicate measurements of two lysate concentrations (3 and 1.5 µg/mL) are graphed as mean +/- SD.
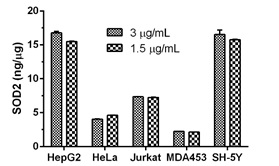
Quantification of SOD2 expression in various cell lines (HepG2, HeLa, Jurkat, MDA-MB-453 (MDA453) and SH-SY5Y (SH-5Y)) using SOD2 Human SimpleStep ELISA KitTM.
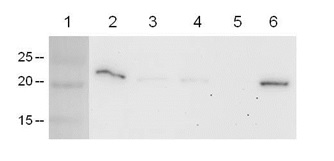
Cell lysates (20 µg) of HepG2 (lane 2), HeLa (lane 3), Jurkat (lane 4), MDA-MB-453 (lane 5) and SH-SY5Y (lane 6) were analyzed by Western blotting using ab13533 as primary antibody. Lane 1 shows migration of molecular weight marker.


