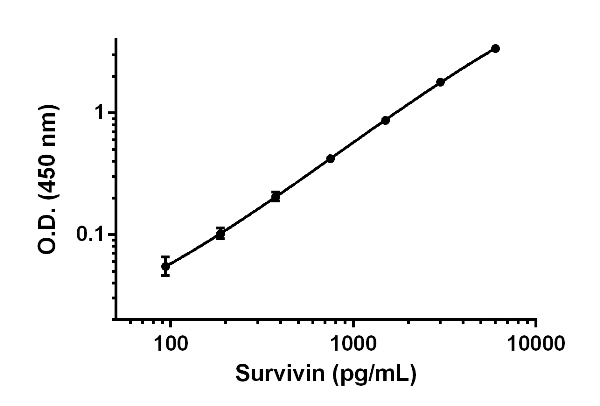
Figure 1. Example of Survivin standard curve for cell culture supernatant and urine samples measurements. Background-subtracted data values (mean +/- SD) are graphed.
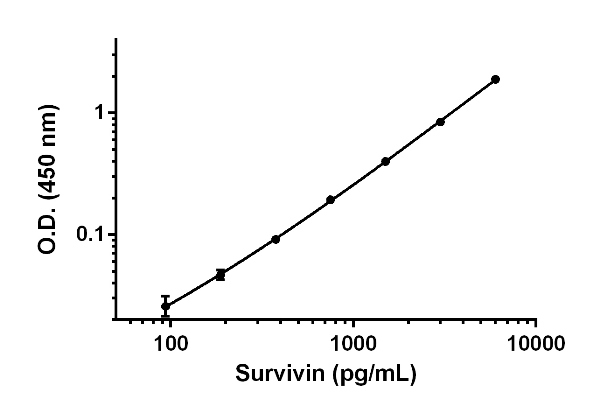
Figure 2. Example of Survivin standard curve for serum and plasma-citrate samples measurements. Background-subtracted data values (mean +/- SD) are graphed.
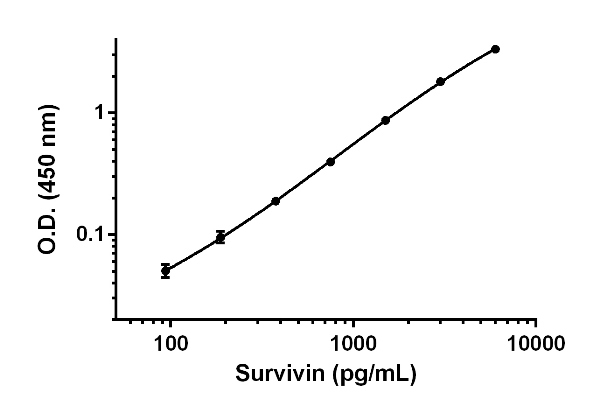
Figure 3. Example of Survivin standard curve for cell and tissue extract samples measurements. Background-subtracted data values (mean +/- SD) are graphed.
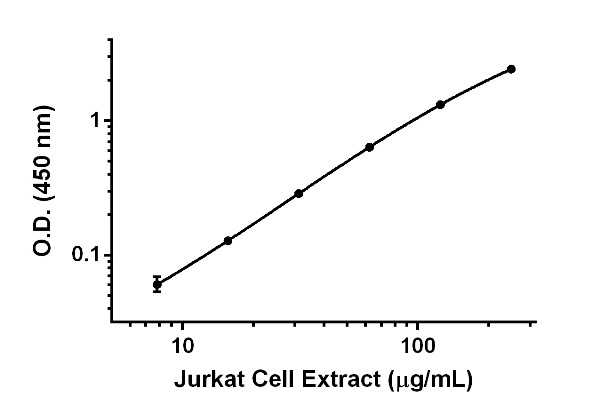
Figure 4. Titration of Jurkat cell extract within the working range of the assay. Background-subtracted data values (mean +/- SD, n=2) are graphed.
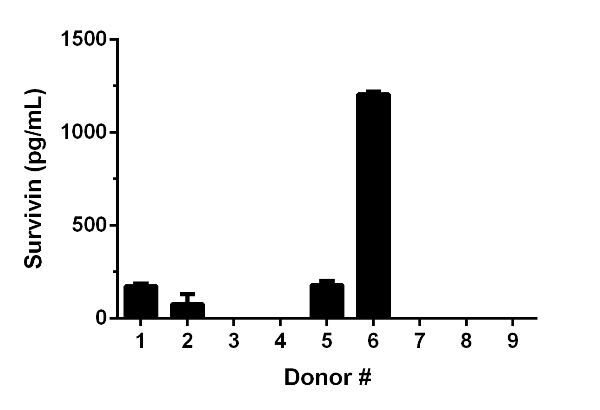
Figure 5. Survivin concentrations in 10 individual Human serum donors. Two fold diluted serum samples from 10 apparently healthy male donors were measured using this kit. Interpolated data values corrected for sample dilution are graphed in pg of Survivin per mL of serum (mean +/- SD, n=3).
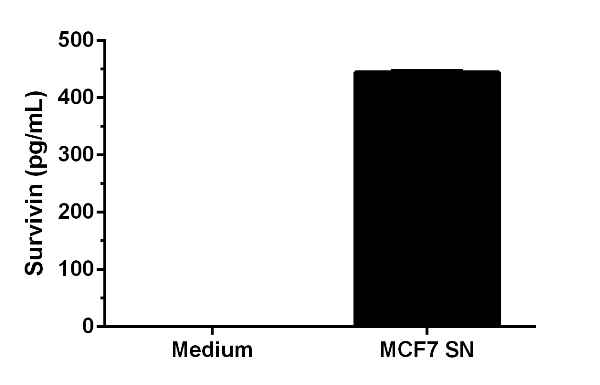
Figure 6. Comparison of Survivin concentrations in media and MCF7 cell supernatants. MCF7 cells were grown in 10F HGDMEM medium and Survivin concentrations were measured in undiluted cell culture supernatant (SN) sample and the 10F HGDMEM medium using this kit. Interpolated data values are graphed (mean +/- SD, n=2). Note that no detectable Survivin concentrations in growth medium were observed.
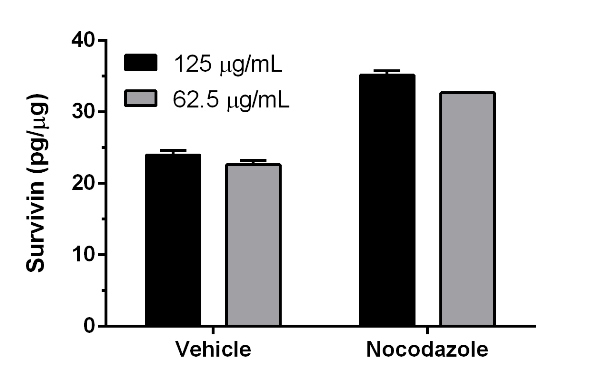
Figure 7. Comparison of Survivin concentrations in control and nocodazole treated HeLa cells. HeLa cells were grown in 10F HGDMEM medium for 17 hours in the presence of 200 ng/mL nocodazole or drug’s vehicle (DMSO). Survivin concentrations were measured in cell extracts diluted to 125 and 62.5 µg/mL using this kit. Interpolated data values expressed in pg Survivin per g of cell extract are graphed (mean +/- SD, n=2).