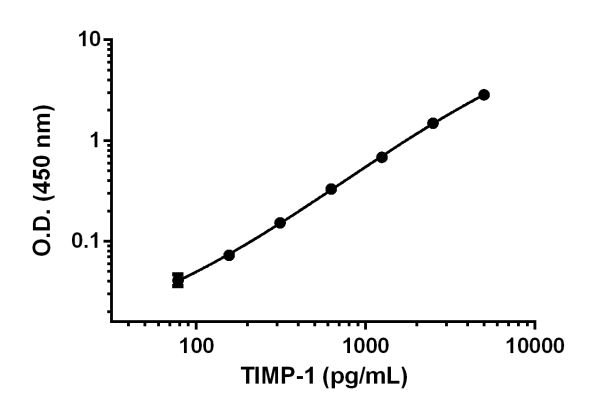
The TIMP1 standard curve was prepared as described in Section 10. Raw data values are shown in the table. Background-subtracted data values (mean +/- SD) are graphed.
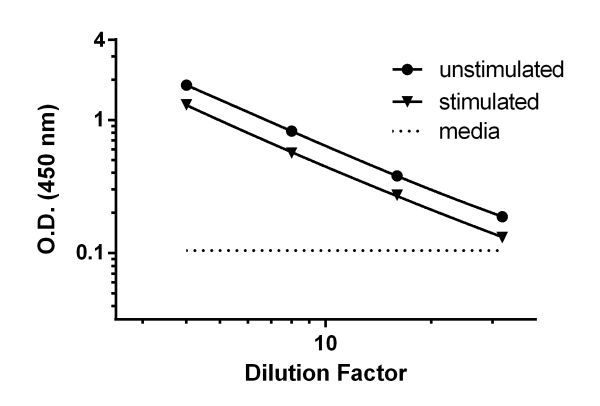
PBMC were grown in the absence or presence of phytohemagglutinin (PHA) for 2 days. TIMP1 was measured in 2, 4, 8, 16 and 32-fold diluted cell culture supernatants of unstimulated and PHA stimulated PBMC. Raw values (Mean +/-SD, n=2) are graphed.
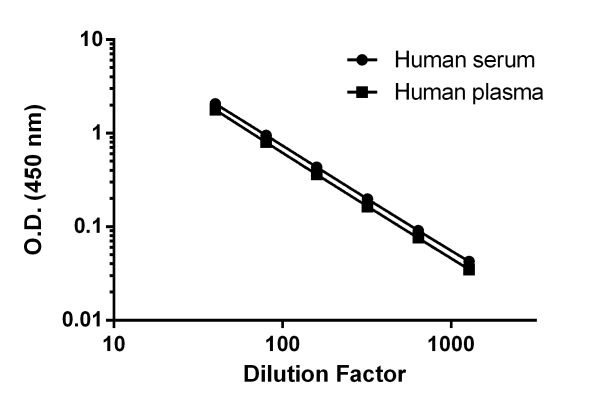
Background subtracted data from duplicate measurements are plotted.
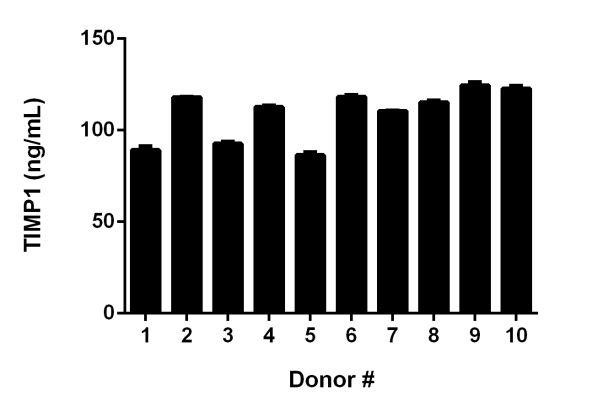
Serum from 10 apparently healthy male donors was measured in triplicate. The mean TIMP1 concentration was determined to be 109 ng/mL with a range of 85 – 125 ng/mL.
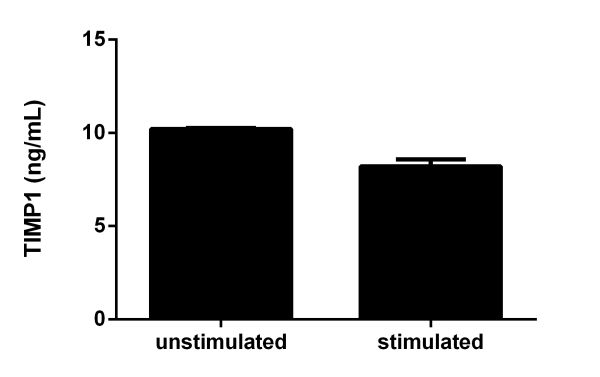
PBMC were grown in the absence (unstimulated) or presence of phytohemagglutinin (PHA) (stimulated) for 2 days (stimulated). TIMP1 was measured in 2-fold diluted cell culture supernatants of unstimulated and PHA stimulated PBMC. Measured values were interpolated from the TIMP1 Standard Curve diluted in Sample Diluent NS and corrected for dilution factor. Mean of duplicate values +/-SD are graphed: 10 ng/mL unstimulated and 8.2 ng/mL stimulated.


