Figure 1. Treatment of HeLa cells with doxorubicin induces phosphorylation of p53 at Ser15, as well as cleavage of PARP and caspase-3 as detected by PathScan ® Apoptosis Multi-Target Sandwich ELISA Kit #7105 and Western analysis. HeLa cells (80-90% confluent) were starved overnight and stimulated with doxorubicin (5 μM at 37ºC for indicated times). Lysates were assayed at a protein concentration of 1 mg/ml. The absorbance readings at 450 nm are shown as a 3-dimensional representation in the left panel, while the corresponding Western blots are shown in the right panel. Antibodies used for Western analysis include Phospho-p53 (Ser15) Antibody #9284, p53 Antibody #9282, Cleaved Caspase-3 (Asp175) Antibody #9661 and PARP Antibody #9542. Total Bad and phospho-Bad (Ser112) proteins were not detected by Western due to low endogenous levels in HeLa cells.

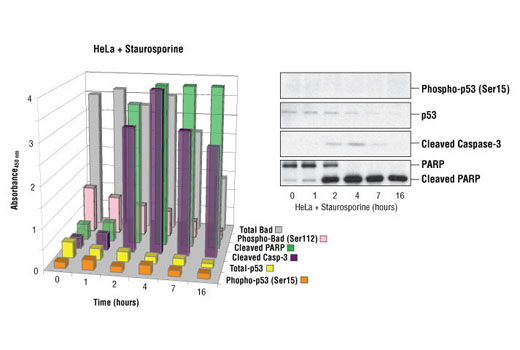
Figure 2. Treatment of HeLa cells with staurosporine induces cleavage of PARP and caspase-3 but not phosphorylation of p53 at Ser15 as detected by PathScan ® Apoptosis Multi-Target Sandwich ELISA Kit #7105 and Western analysis. HeLa cells (80-90% confluent) were starved overnight and stimulated with staurosporine (2 μM at 37ºC for indicated times). Lysates were assayed at a protein concentration of 1 mg/ml. The absorbance readings at 450 nm are shown as a 3-dimensional representation in the left panel, while the corresponding Western blots are shown in the right panel. The antibodies used for the Western analyses include Phospho-p53 (Ser15) Antibody #9284, p53 Antibody #9282, Cleaved Caspase-3 (Asp175) Antibody #9661 and PARP Antibody #9542. Total Bad and Phospho-Bad (Ser112) proteins were not detected by Western due to low endogenous levels in HeLa cells.

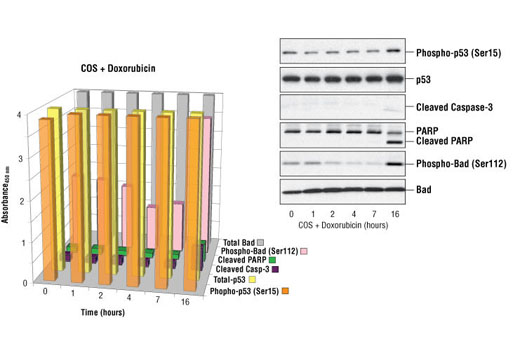
Figure 3. Treatment of COS cells with doxorubicin induces low levels apoptosis as detected by PathScan ® Apoptosis Multi-Target Sandwich ELISA Kit #7105 and Western analysis. COS cells (80-90% confluent) were starved overnight and stimulated with doxorubicin (5 μM for at 37ºC for indicated times). Lysates were assayed at a protein concentration of 1 mg/ml. The absorbance readings at 450 nm are shown as a 3-dimensional representation in the left panel, while the corresponding Western blots are shown in the right panel. The antibodies used for the Western analyses include Phospho-p53 (Ser15) Antibody #9284, p53 Antibody #9282, Cleaved Caspase-3 (Asp175) Antibody #9661, PARP Antibody #9542, Phospho-Bad (Ser112) (7E11) Mouse mAb #9296 and Bad Antibody #9292.

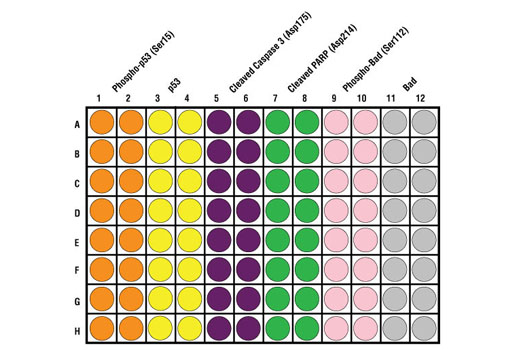
Figure 4. Schematic representation of a 96-well plate depicting the color-code of the reagents used to detect endogenous levels of Phospho-p53 (Ser15) (orange; 1 & 2), p53 (yellow; 3 & 4), Cleaved Caspase 3 (Asp175) (purple; 5 & 6), Cleaved PARP (Asp214) (green; 7 & 8), Phospho-Bad (Ser112) (pink; 9 & 10) and Bad protein (grey; 11 & 12).


