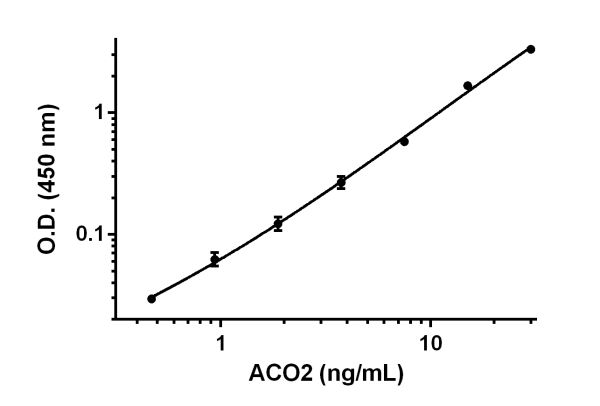
Background-subtracted data values (mean +/- SD) are graphed.
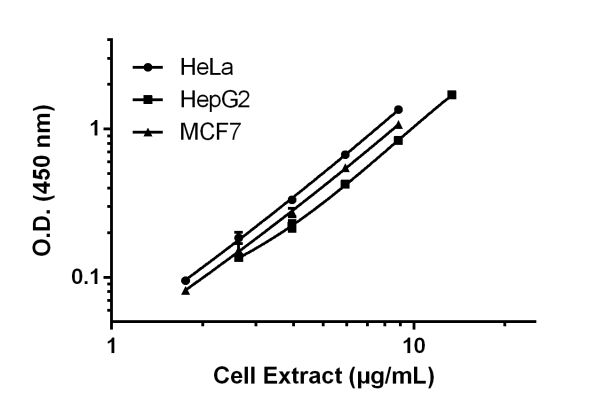
Background-subtracted data values (mean +/- SD, n = 2) are graphed.
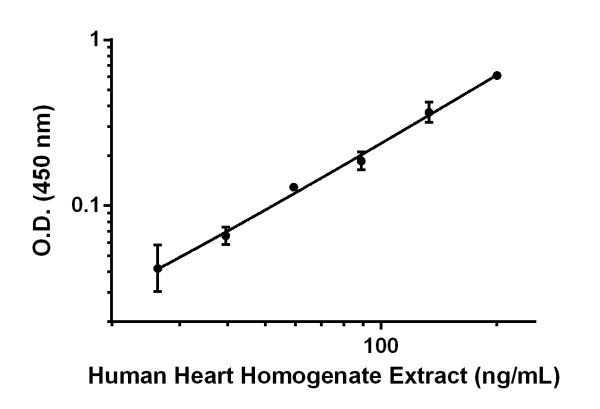
Background-subtracted data values (mean +/- SD, n = 2) are graphed.
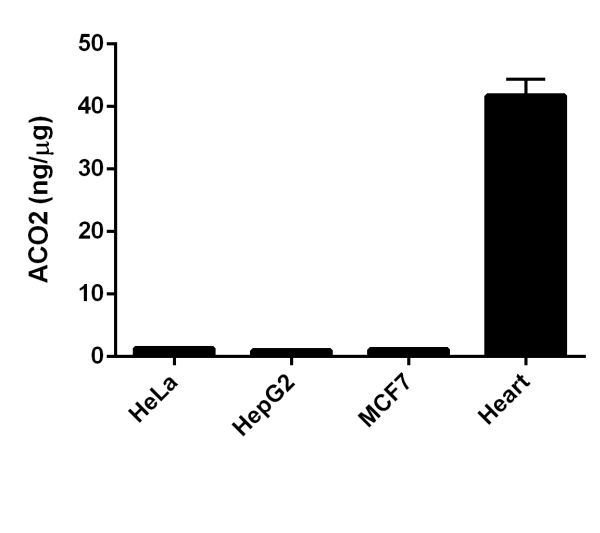
Three concentrations (within the working range of the assay) of the cell and tissue extracts were analyzed in duplicates with this kit. The concentrations of Aconitase 2 were interpolated from data values using Aconitase 2 standard curve, corrected for sample dilution, and graphed in ng of Aconitase 2 per µg of extract (mean +/- SD, n=3).
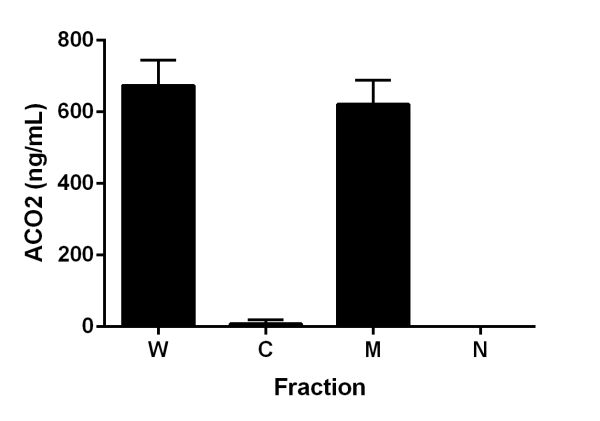
Cytosolic (C), membrane-containing mitochondrial (M) and nuclear (N) fractions were prepared using Cell Fractionation Kit (ab109719). One volume of 5X Cell Extraction Buffer PTR was added to four volumes of each subcellular fractions as well as to the starting material used for the fractionation - whole cell suspension (W), and the extracts were prepared as described in the Sample Preparation section. The extracts were diluted 50X in the 1X Cell Extraction Buffer PTR and analyzed in duplicates with this kit. The concentrations of Aconitase 2 were interpolated from data values using Aconitase 2 standard curve, corrected for sample dilution, and graphed (mean +/- SD, n=2) in ng of Aconitase 2 per mL of extract. All extracts were derived from 2.64 x 10⁶ cell/mL.
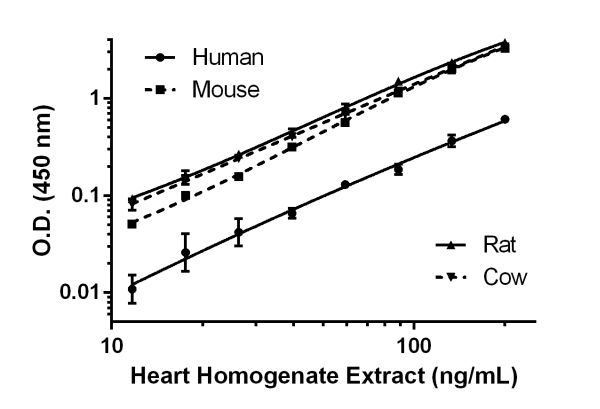
Background-subtracted data values (mean +/- SD, n = 2) are graphed.


