Figure 2: The relationship between protein concentration of lysates from untreated and EGF-treated A431 cells and kit assay optical density readings. After starvation, A431 cells (85% confluence) were treated with EGF (100 ng/ml) for 5 min at 37°C, and then lysed.

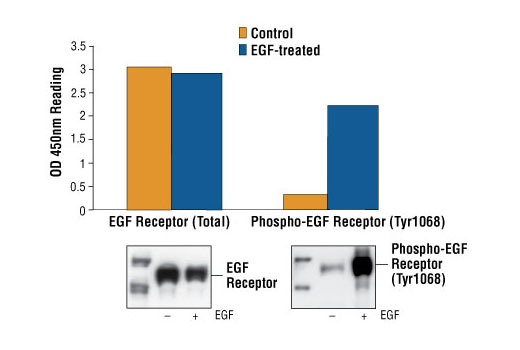
Figure 1: Treatment of A431 cells with EGF stimulates phosphorylation of EGF Receptor at Tyr1068, detected by PathScan® Phospho-EGF Receptor (Tyr1068) Sandwich ELISA kit #7240, but does not affect the level of total EGF Receptor detected by PathScan® Total EGF Receptor Sandwich ELISA kit #7250. OD 450nm readings are shown in the top figure, while the corresponding western blot using Phospho-EGF Receptor (Tyr1068) Antibody #2234 (right panel) or EGF Receptor Antibody #2232 (left panel), is shown in the bottom figure.

Figure 3: Kit specificity demonstrated by western blot analysis of the ELISA-well captured protein. Lysates prepared from human A431 cells were incubated in wells coated with an EGF Receptor capture antibody. Wells were washed and captured protein was solubilized in SDS gel loading buffer. A431 lysate (lane 1) and captured protein (lane 2) were analyzed by western blot using an EGF Receptor detection antibody. A single band corresponding to the EGF Receptor is detected in the captured material (lane 2).


