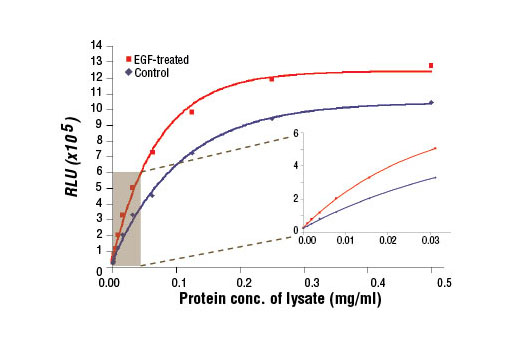
Figure 1. The relationship between protein concentration of lysates from A-431 cells, untreated or treated with hEGF #8916, and immediate light generation with chemiluminescent substrate. After starvation, A-431 cells (85% confluence) were treated with hEGF (100 ng/ml, 5 min at 37°C) and then lysed. Graph inset corresponding to the shaded area shows high sensitivity and a linear response at the low protein concentration range.

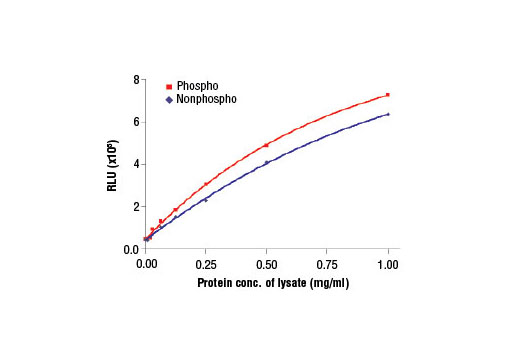
Figure 2. The relationship between protein concentration of lysates prepared using H1975 cells, lysed with (phospho) and without (nonphospho) the addition of phosphatase inhibitors to the lysis buffer, and immediate light generation using chemiluminescent substrate.

