IL3RA protein (Fc Chimera)
| Name | IL3RA protein (Fc Chimera) |
|---|---|
| Supplier | Abcam |
| Catalog | ab88358 |
| Category | Protein |
| Applications | FA SDS-PAGE |
| Species Reactivities | Human |
| Nature | Recombinant |
| Source | HEK 293 cells |
| Purity | > 95 % by SDS-PAGE. |
| SwissProt/Accession | P26951 |
| Gene | IL3RA |
| Residue | 19 to 302 |
| Sequence | TKEDPNPPITNLRMKAKAQQLTWDLNRNVTDIECVKDADYSMPAVN NS YCQFGAISLCEVTNYTVRVANPPFSTWILFPENSGKPWAGAENL TCWI HDVDFLSCSWAVGPGAPADVQYDLYLNVANRRQQYECLHYKT DAQGTR IGCRFDDISRLSSGSQSSHILVRGRSAAFGIPCTDKFVVF SQIEILTP PNMTAKCNKTHSFMHWKMRSHFNRKFRYELQIQKRMQP VITEQVRDRT SFQLLNPGTYTVQIRARERVYEFLSAWSTPQRFECD QEEGANTRGGRV DGIQWIPKVDKKVEPKSCDKTHTCPPCPAPELLG GPSVFLFPPKPKDT LMISRTPEVTCVVVDVSHEDPEVKFNWYVDGV EVHNAKTKPREEQYNS TYRVVSVLTVLHQDWLNGKEYKCRVSNKAL PAPIEKTISKAKGQPREP QVYTLPPSRDELTKNQVSLTCLVKGFYP SDIAVEWESNGQPENNYKTT PPVLDSDGSFFLYSKLTVDKSRWQQG NVFSCSVMHEALHNHYTQKSLS LSPGK |
| Supplier Page | Shop |
Product images
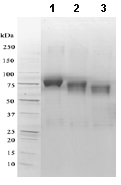 1D SDS-PAGE of ab88358 before and after treatment with glycosidases to remove oligosaccharides. Lane 1: ab88358 Lane 2: ab88358 treated with PNGase F to remove potential N-linked glycans Lane 3: ab88358 treated with a glycosidase cocktail to remove potential N- and O-linked glycans. Drop in MWt after treatment with PNGase F indicates presence of N-linked glycans. Subsequent drop in MWt after treatment with glycosidase cocktail indicates presence of O-linked glycans. Faint bands in lane 2 and lane 3 are glycosidase enzymes.
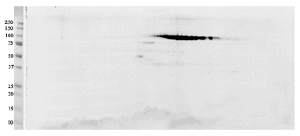 A sample of ab88358 without carrier protein was reduced and alkylated and focused on a 3-10 IPG strip then run on a 4-20% Tris-HCl 2D gel. Spot train indicates presence of multiple isoforms of ab88358.
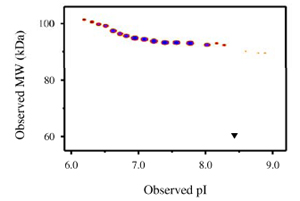 Densitometry of protein isoforms visualised by 2-DE. The densitometry scan demonstrates the purified human cell expressed protein exists in multiple isoforms, which differ according to their level of post-translational modification. The triangle indicates the theoretical MWt and pI of the protein.