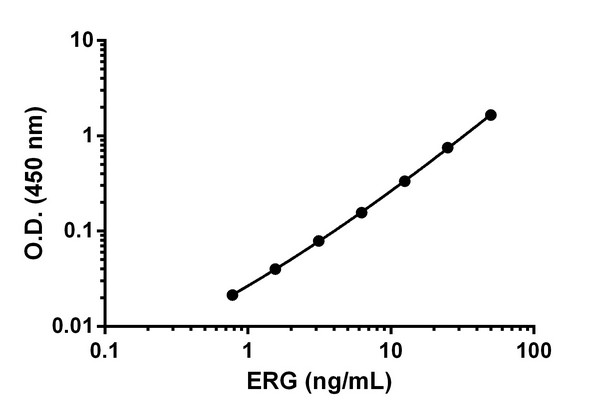
Figure 1. Example of ERG standard curve. Background-subtracted data values (mean +/- SD) are graphed.

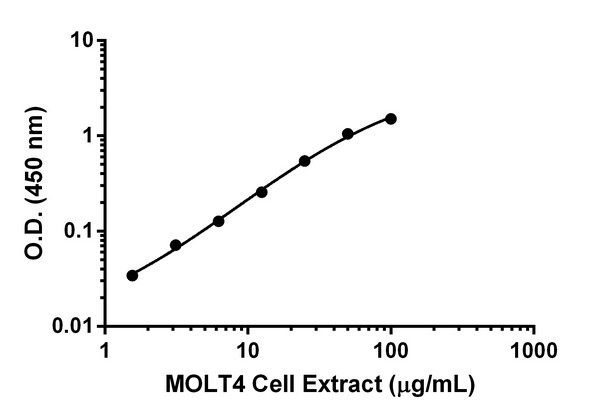
Figure 2. Titration of MOLT4 cell extract within the working range of the assay. Background subtracted data from duplicate measurements are plotted.

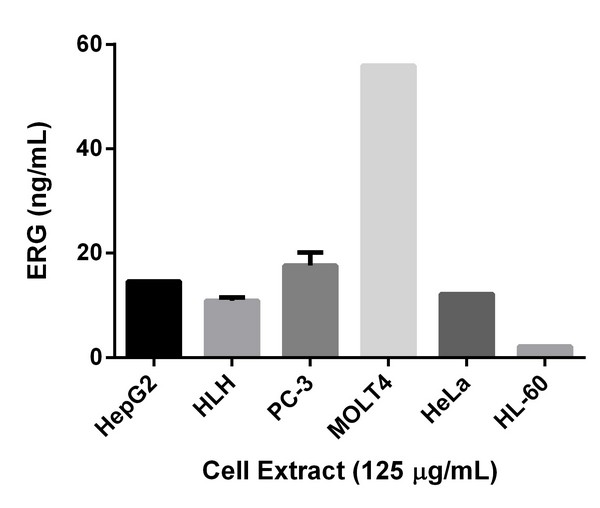
Figure 3. Comparison of ERG expression in different cell lines. Interpolated values of ERG are plotted for the indicated cell lines based on a cell culture extract concentration of 125 µg/mL.

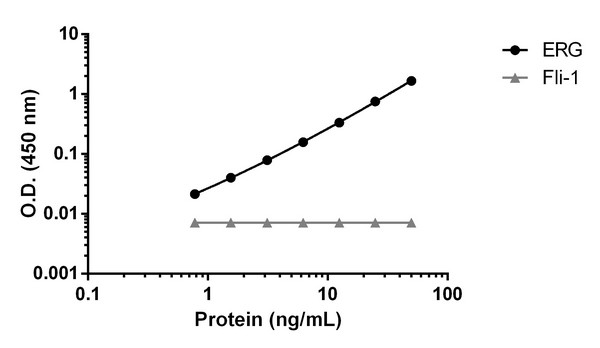
Figure 4. The ERG SimpleStep ELISA validated for assay specificity against Fli-1 protein. Fli-1 is an ETS transcription factor family member and highly homologous to ERG. Background-subtracted data values (mean +/- SD) are graphed. No cross reactivity was observed.


