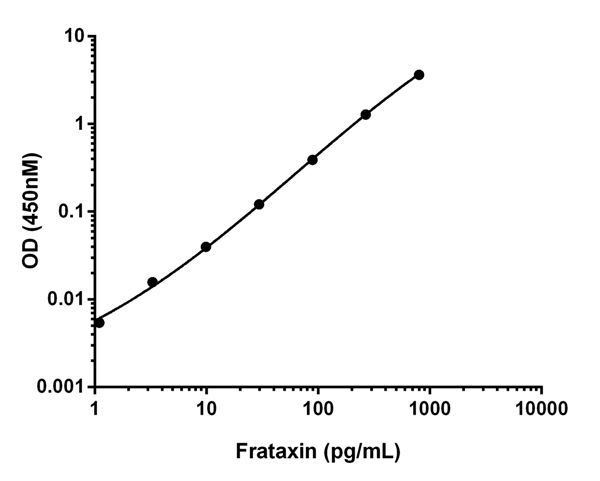
Background-subtracted data values (mean +/- SD) are graphed.

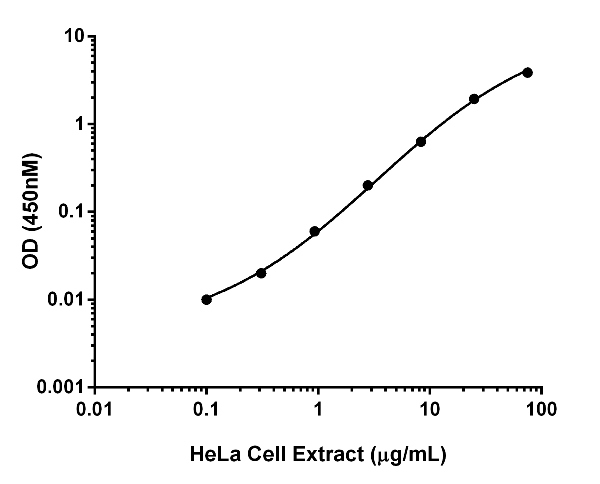
Background subtracted data from duplicate measurements are plotted.

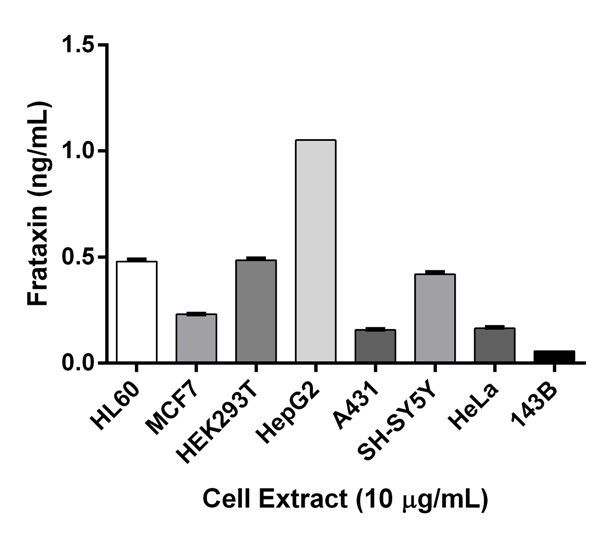
Interpolated values of Frataxin are plotted for the indicated cell lines based on a extract load of 10 µg/mL.

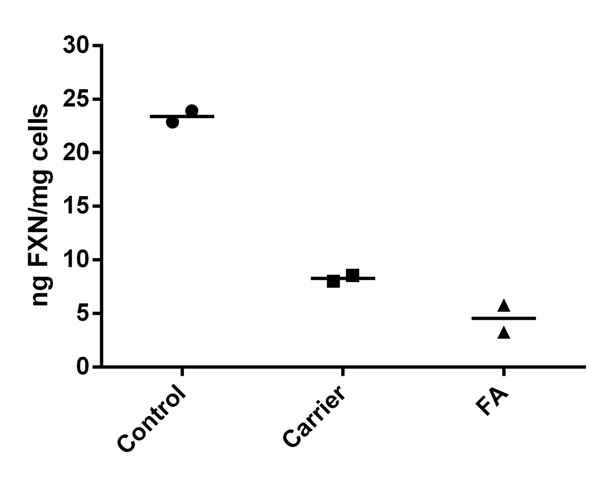
Transformed B lymphocyte cells from Friedreich's Ataxia (FRDA) samples, due to a stable homozygous GAA repeat insertion, are compared to heterozygous carrier B lymphocyte cells and control B lymphocyte cells. B lymphocyte cell extracts were analyzed across a 7-point titration (0.1-100 µg/mL) and frataxin levels were interpolated from the standard curve. Average interpolated values of Frataxin are plotted.


