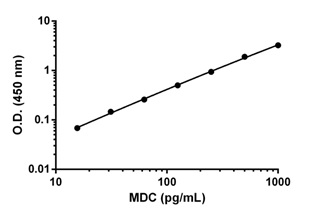
Background-subtracted data values (mean +/- SD) are graphed.
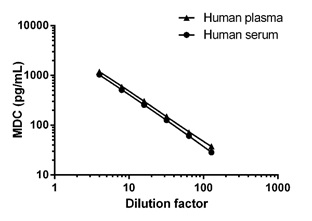
The concentrations of MDC were interpolated from the MDC standard curve and corrected for sample dilution. The mean MDC concentration was determined to be 2,389 pg/mL in plasma (citrate) and 1,989 pg/mL in serum.
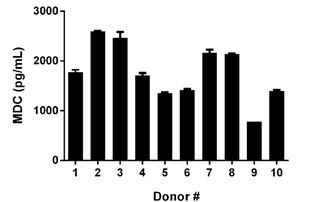
Serum from 10 apparently healthy male donors was measured in duplicate for MDC. The mean MDC concentration was determined to be 1,779 pg/mL with a range of 779 – 2,587 pg/mL.
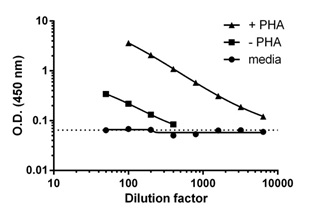
PBMC were grown in the absence or presence of phytohemagglutinin (PHA) for 2 days. MDC was measured in a dilution series of cell culture supernatants of the PHA stimulated PBMC, unstimulated PBMC and media. Raw data values (mean +/-SD, n=2) are graphed. The dotted line represents zero sample background.
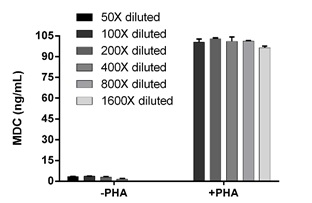
The concentrations of MDC were interpolated from the raw data values used in Figure 3 using the MDC standard curve and corrected for sample dilution. The mean MDC concentration was determined to be 100.4 ng/mL in stimulated PBMC supernatants and 3.358 ng/mL in unstimulated PBMC.
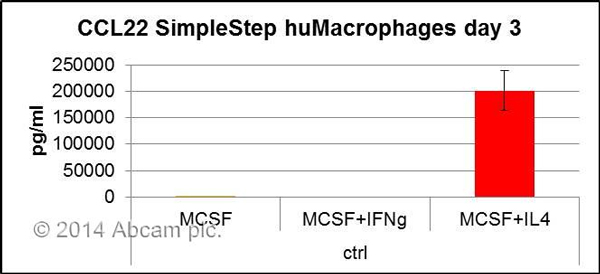
Data shows specific secretion of MDC (CCL22) by human macrophages differentiated in culture for 3 days in presence of MCSF + IL4.


