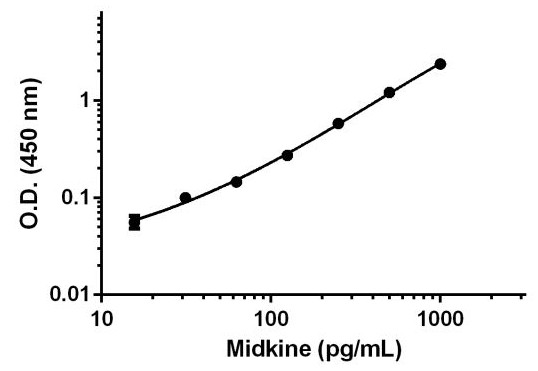
Background-subtracted data values (mean +/- SD) are graphed.
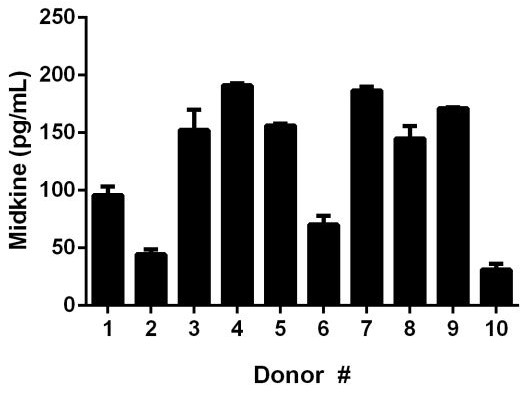
Ten individual healthy donors were evaluated for the presence of Midkine in serum using this assay. Results were interpolated from the standard curve in Sample Diluent 25BP and corrected for sample dilution (1:2). The mean level of Midkine was found at 124.5 pg/mL with a range of 31.2 pg/mL to 191 pg/mL.
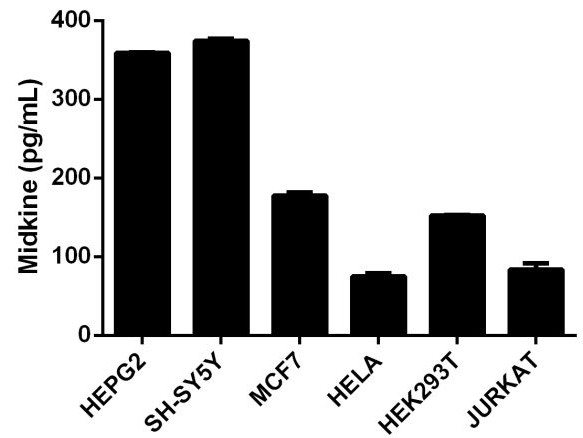
Six different cell lines were loaded at 25 µg/mL in duplicates to evaluate the intracellular levels of Midkine. The cell line with the highest expression of Midkine was SH SY5Y with 374 pg/mL and the lowest expression cell line was HeLa with 78.5 pg/mL
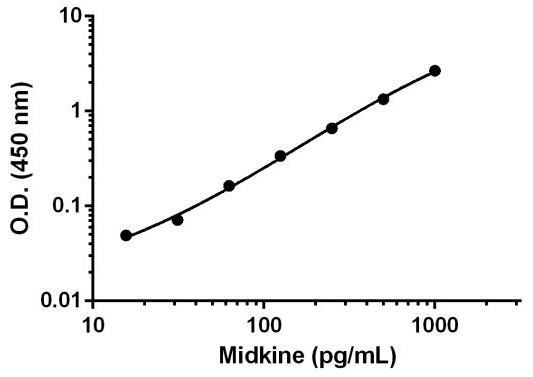
Background-subtracted data values (mean +/- SD) are graphed.

Background-subtracted data values (mean +/- SD) are graphed.
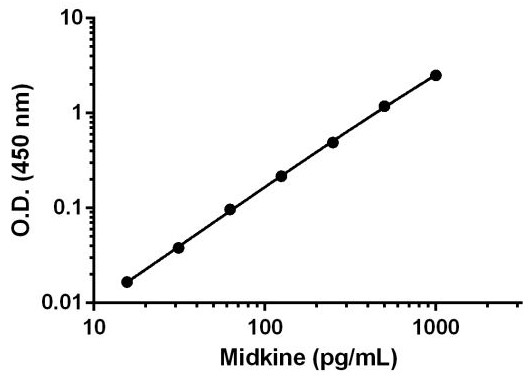
Background-subtracted data values (mean +/- SD) are graphed.


