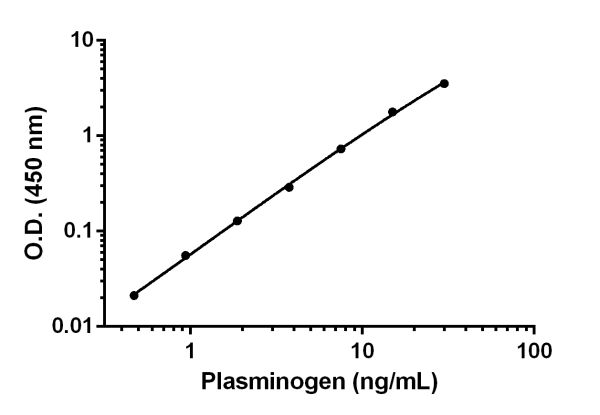
Background-subtracted data values (mean +/- SD) are graphed.

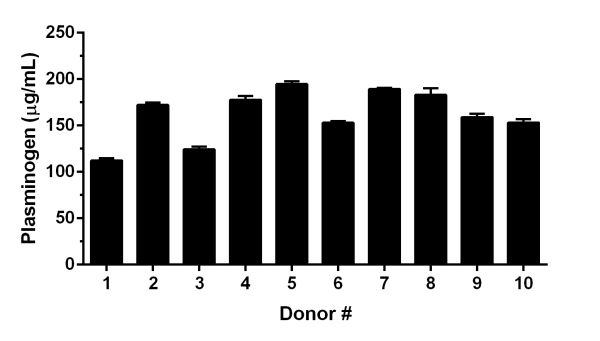
6,000X diluted serum samples from 10 apparently healthy male donors (1 – 10) were measured in triplicates using this kit. Interpolated data values corrected for sample dilution are graphed in µg of Plasminogen per mL of serum (mean +/- SD, n=3). The mean of Plasminogen concentration of these serum samples was determined to be 161.9 µg /mL with a range of 112.3 – 194.6 µg /mL.

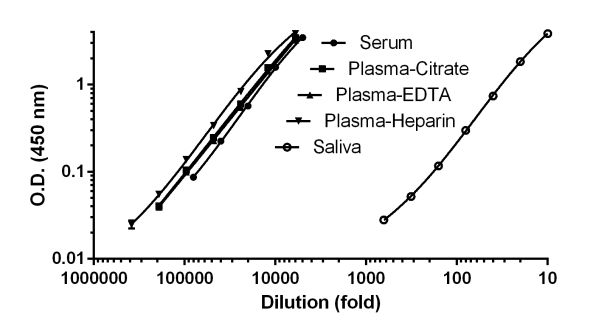
Background-subtracted data values (mean +/- SD, n = 3) are graphed.

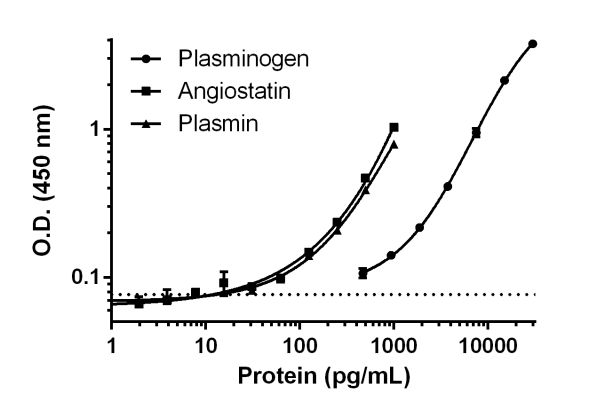
Serial dilutions of Human native purified angiostatin (ab88558) and Human native purified plasmin (ab90928) along with Plasminogen Human Native Protein standard and 26 Blank wells were analyzed. The Plasminogen standard curve was prepared as described in Section 10. Raw data values (mean +/- SD) are graphed. The Mean of Blank controls is indicated by dotted line. Using the Plasminogen standard curve, the MDD in this experiment was determined to be 156 pg/mL.


