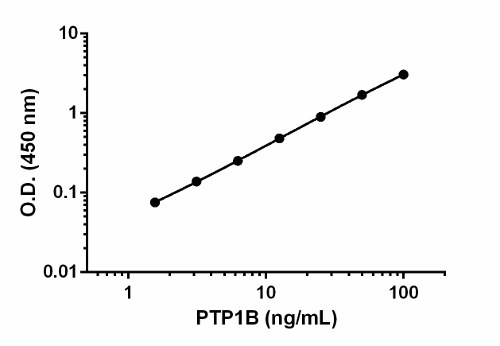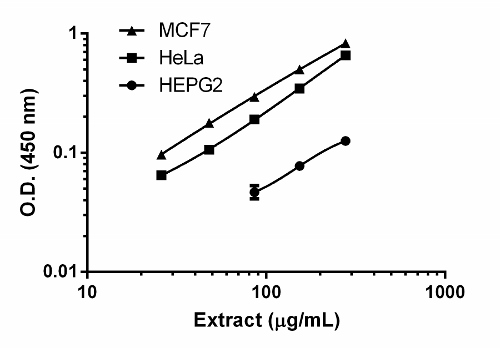
Background-subtracted data values (mean +/- SD) are graphed.

Background subtracted data from duplicate measurements are plotted.

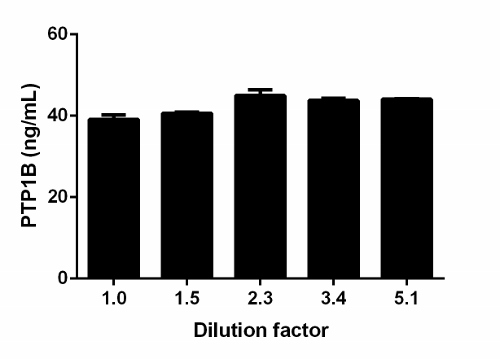
The concentrations of PTP1B protein were interpolated from the PTP1B standard curve and corrected for sample dilution relative to extract load of 333 µg/mL. The mean PTP1B concentration was determined to be 42.5 ng/mL in MCF7 extract at 333 µg/mL

Interpolated values of PTP1B are plotted for the indicated cell lines based on an extract load of 250 µg/mL. The PTP1B detector antibody was used to analyze the same extracts by western blot (20 µg loaded/lane).


