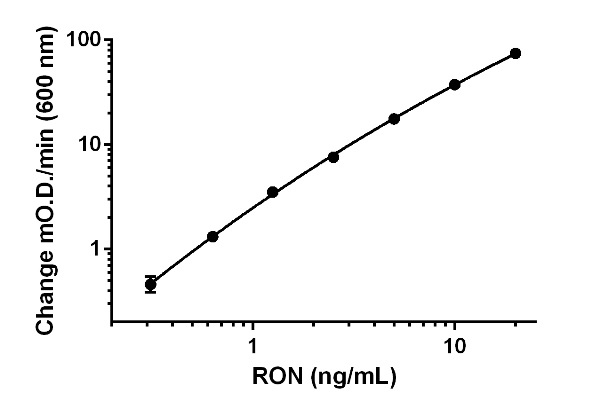
Background-subtracted data values (mean +/- SD) are graphed.

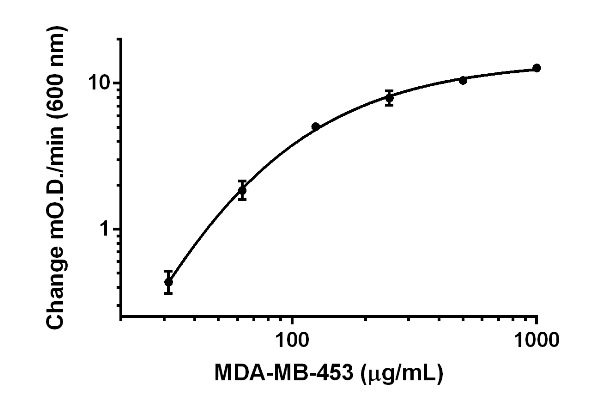
The extract of MDA-MB-453 cells was prepared from cell pellet. Background-subtracted data values (mean +/- SD, n=3) are graphed.

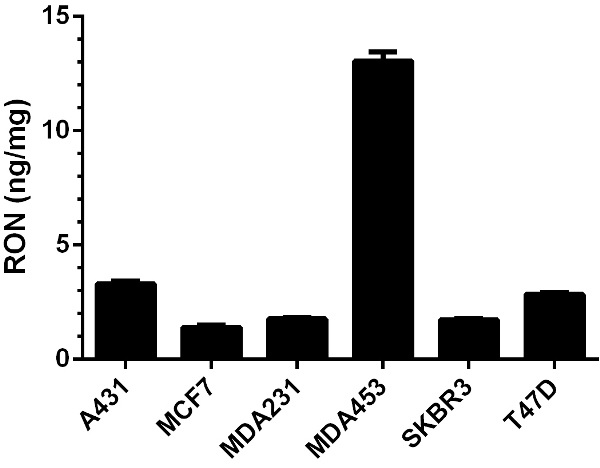
Samples of A431, MCF7, MDA-MB-231 (MDA231), SKBR3, T47D at 1,000 µg/mL and MDA-MB453 (MDA453) at 250 µg/mL were analyzed using the assay kit. The concentrations of RON in these samples were interpolated using RON standard curve. The RON concentrations divided by the total cellular protein in the analyzed samples are graphed (mean +/-SD, n=3).

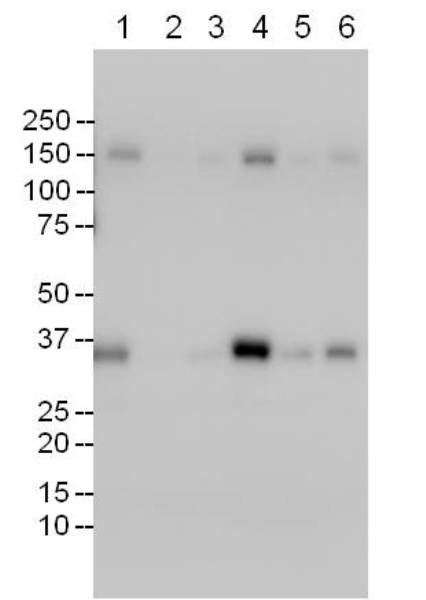
Comparison of RON expression in various cell lines were analyzed by Western blotting using the detector antibody of this kit.1 - A4312 - MCF73 - MDA-MB-231(MDA231)4 - MDA-MB453 (MDA453)5 - SKBR36 - T47D20 µg of each cell lysate was loaded.


