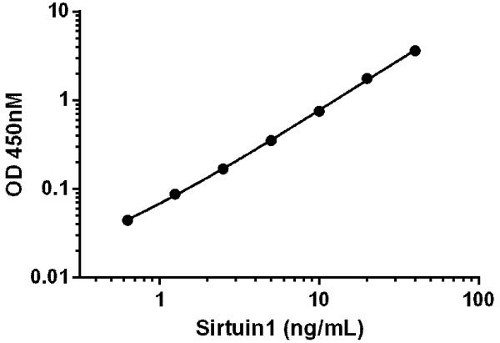
Example SIRT1 standard curve. Background-subtracted data values (mean +/- SD) are graphed.

Titration of HeLa extract within the working range of the assay. Background subtracted data from duplicate measurements are plotted.

Comparison of SIRT1 expression in different cell lines. Background subtracted data from duplicate measurements are plotted. Note the relative lower expression of SIRT1 in the A431 cell line.

Interpolated values of sirtuin1 are plotted for the indicated cell lines based on a lysate load of 125 µg/mL. Western blot using the detector sirtuin1 antibody on the same lysates quantified above.

Immunocytochemical staining of Human HDFn cells using the SIRT1 detector antibody in this kit (ab1100304). The target protein locates mainly in the nucleus.


