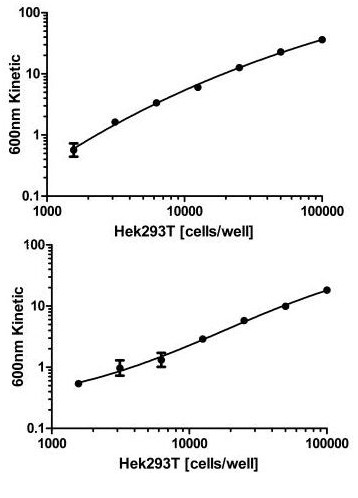
Figure 1. Dynamic range of Hek293T cells. Cells were seeded the day before at the specified cell densities. The signal was obtained using this kit as described. Total SIRT1 (TOP) and SIRT1 phospho S47 (BOTTOM) are shown after background subtraction.

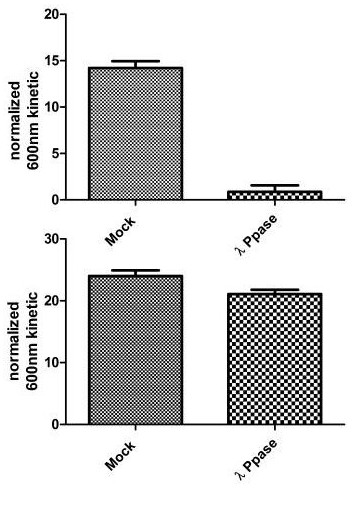
Figure 2. Specificity of Signal by In Cell ELISA. Hek293T cells were seeded on an amine coated plate at 12 k, 25 k and 50 k/well the day before fixation. Levels of total SIRT1 and phosphorylated protein at S47 were measured after permeabilizing with methanol at -20ᵒ C for 25 minutes. Once the methanol was washed with PBS, treatment with 1:100 dilution of LP was carried out at 40˚C for 45 minutes on a plate heater. Blocking and antibody incubations were carried out according to this protocol. Data is shown as the mean of different wells at different cell densities after normalization with Janus green.

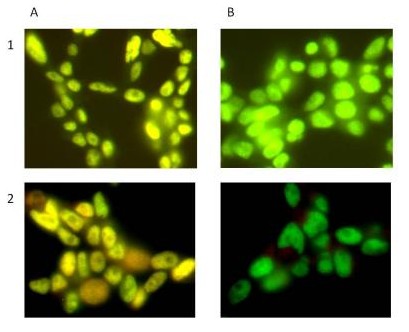
Figure 3. Specificity of Signal by Immunocytochemistry. Hek293T cells were seeded on glass coverslips and allowed to adhere overnight. Levels of SIRT1 and phosphorylated protein at S47 were measured after permeabilizing with 0.1% Triton (Panel 1) and methanol (Panel 2) followed by Lambda phosphatase treatment (Panel B). The total SIRT1 signal was labeled with GAM-488 and the SIRT1 pS47 with GAR-594. Panel B shows a reduction in phosphorylation due to LP treatment.

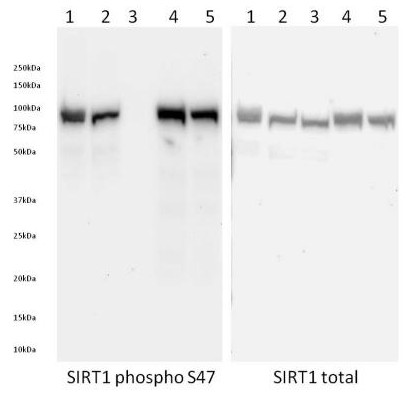
Figure 4. Specificity of signal by Western Blot. Western Blot was run on a 4-15% gradient acrylamide gel. Samples were loaded as follows from left to right: (1) 40 µg of control Hek293T cell extract, (2) 40 µg of mock treated Hek293T cell extract, (3) 40 µg of 1:100 LP treated Hek293T cell extract, (4) 40 µg of 50 nM calyculin treated Hek293T cell extract and (5) 40 µg of 0.5% DMSO treated Hek293T cell extract. Membrane blocking (1 hour RT), primary antibody incubation (overnight 4ᵒC) and secondary antibody incubation (2 hours RT) were all carried out with 1X block (ab126587) in PBS + 0.05% Tween.


