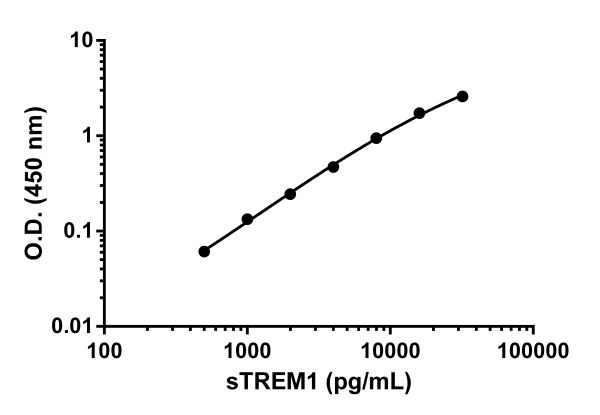
Background-subtracted data values (mean +/- SD) are graphed.

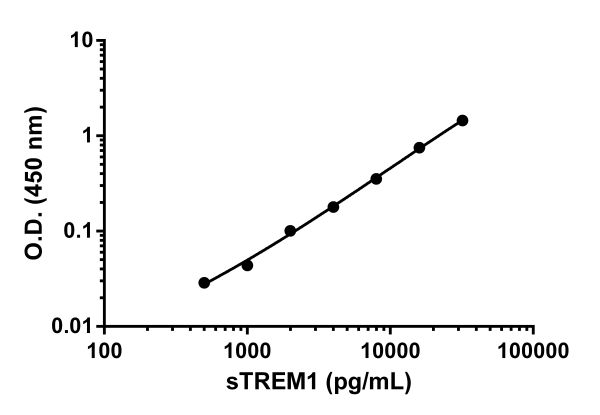
Background-subtracted data values (mean +/- SD) are graphed.

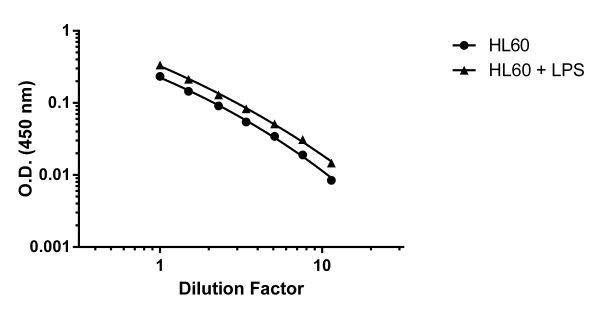
HL60 cells were grown in culture with or without the addition of (5 µg/mL) LPS for 24 hours before supernatants were collected and assayed. Background subtracted data from duplicate measurements are plotted.

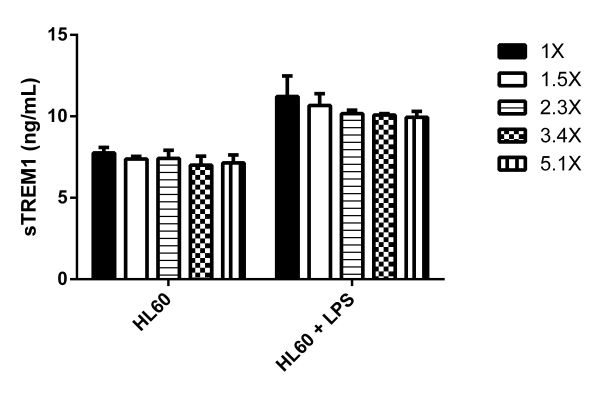
HL60 cells were grown in culture with or without the addition of (5 µg/mL) LPS for 24 hours before supernatants were collected and assayed. Bar graph denotes quantification of sTREM1 interpolated from standard curve and multiplied by dilution factor.


