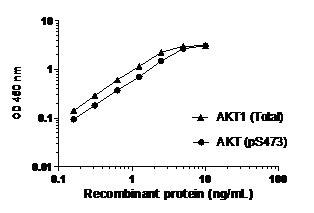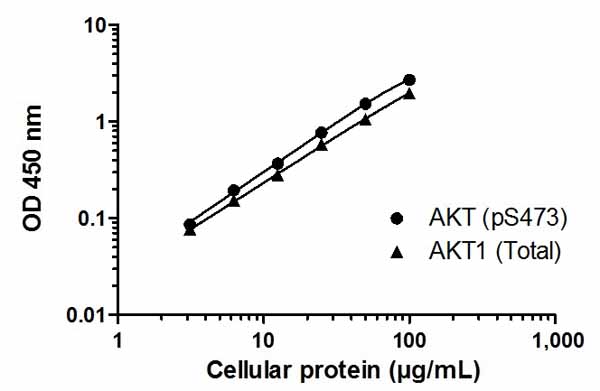
Example of a typical AKT (pS473) and AKT1 (Total) cell lysate dilution series. Background-subtracted data values (mean +/- SD) are graphed.
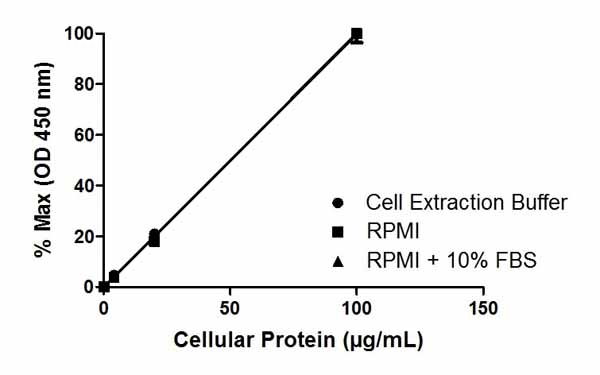
Linearity of dilution in representative sample matrices. Cellular lysates were prepared at 3 concentrations in common media containing 1X Cell Extraction Buffer PTR. Data from duplicate measurements of AKT1 (pS473) are normalized and plotted.
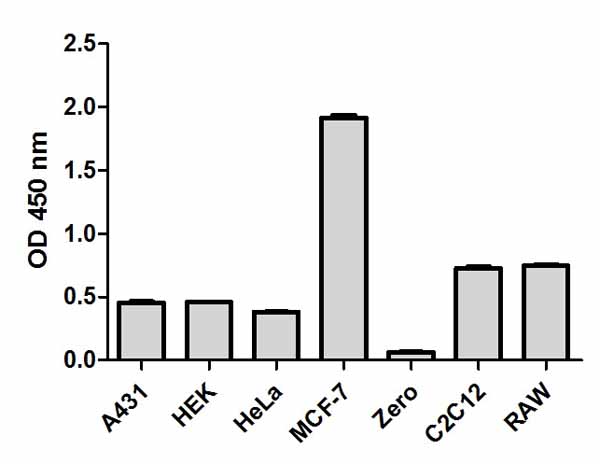
Cell line analysis for total AKT1 from 20 µg/mL preparations of cell extracts. Data from triplicate measurements (mean +/- SD) are plotted and compared to 1X Cell Extraction Buffer PTR (zero).
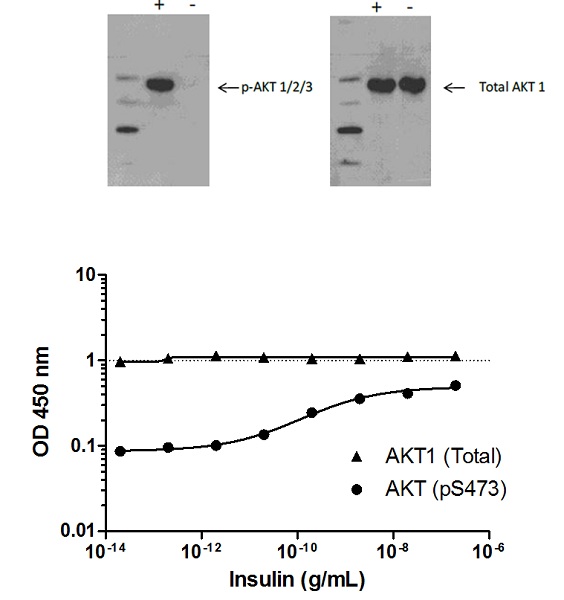
Induction of AKT (pS473) phosphorylation in MCF-7 cells in response to insulin treatment. MCF-7 cells were cultured in 96-well tissue culture plates, serum-starved and treated (5 min) with a dose-range of insulin before cell lysis. Data from quadruplicate measurements of AKT (pS473) are plotted and compared against total AKT1 protein levels. Comparative AKT (pS473) and AKT1 (Total) data also shown by Western Blot.
