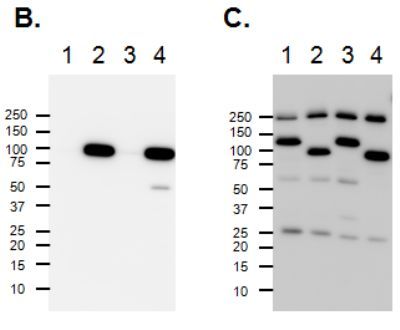
Figure 4B&C. Demonstration of assay specificity by inducing PARP cleavage with Staurosporine. (B) Western blot using the Cleaved PARP ELISA capture antibody. (C) Western blot using the Cleaved PARP ELISA detector antibody. The same extract preparations of vehicle-treated (lane1) or Staurosporine-treated (lane 2) HeLa cells, and of vehicle-treated (lane 3) or Staurosporine-treated (lane 4) Jurkat cells were used in both ELISA and Western blot analyses. The data demonstrate that the ELISA kit measures specifically the 89 kDa fragment of PARP-1. Note of complete cleavage of PARP in the Staurosporine-treated HeLa and Jurkat samples (in C).
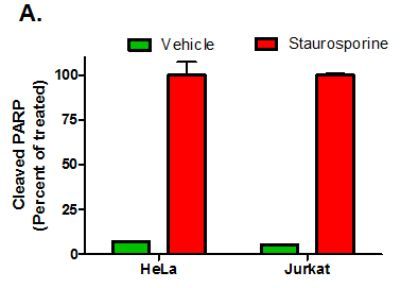
Figure 4A. Demonstration of assay specificity by inducing PARP cleavage with Staurosporine. Cleaved PARP ELISA using vehicle or Staurosporine treated HeLa extracts (250 ug/mL) or Jurkat extracts (125 ug/mL).
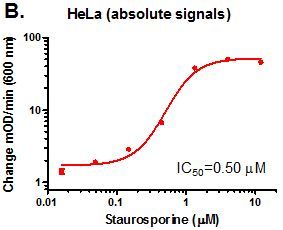
Figure 3B. Example of IC50 determination. Lysates were prepared by direct in-well lysis without media removal from HeLa cells grown and treated with variable doses of Staurosporine in a 96-well plate. Absolute signals HeLa lysates (corresponding to 2.5x10⁵ cells/mL) are shown.
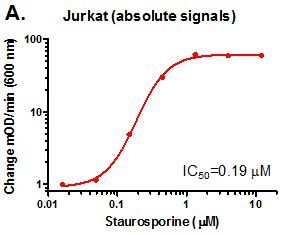
Figure 3A. Example of IC50 determination. Lysates were prepared by direct in-well lysis without media removal from Jurkat cells grown and treated with variable doses of Staurosporine in a 96-well plate. Absolute signals of Jurkat lysates (corresponding to 10X105 cells/mLare shown.
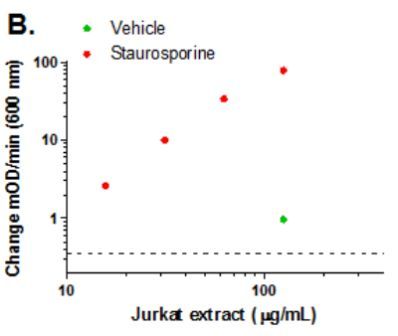
Figure 2B. Example experimental analysis of pellet extracts prepared from Jurkat (B) cells treated with vehicle or Staurosporine. Cell extracts at varying concentrations within the working range of the assay were analyzed. Absolute signals (without zero standard subtraction) are shown. Dashed lines represent signals of zero standard (Incubation Buffer only).
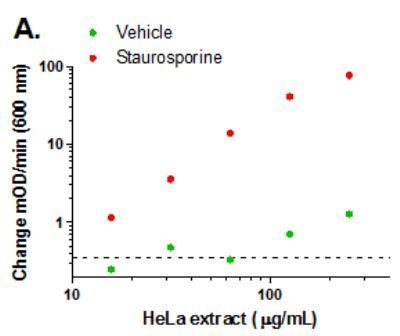
Figure 2A. Example experimental analysis of pellet extracts prepared from HeLa cells treated with vehicle or Staurosporine. Cell extracts at varying concentrations within the working range of the assay were analyzed. Absolute signals (without zero standard subtraction) are shown. Dashed lines represent signals of zero standard (Incubation Buffer only).
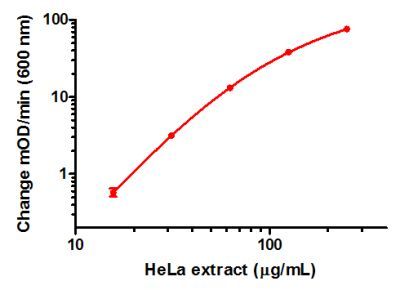
Figure 1. Example standard curve. A dilution series of pellet extracts in Incubation Buffer in the working range of the assay. The lysates were prepared from a pellet of HeLa cells treated with Staurosporine.


