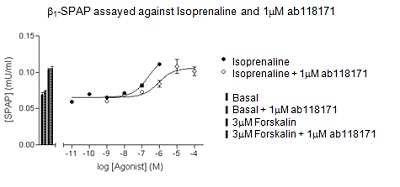
The apparent KD was calculated from the rightward shift of the agonist response curve in the presence of ab118171, compared to the response curve for the agonist alone, for β1 receptor expressing cell line.
Go to product page
Image may be subject to copyright.